Meet Canary7
The Definitive Guide to Power BI Inventory Management Dashboard

Reliable, Robust 3PL Solutions; Now at your service.

Meet Canary7
The Definitive Guide to Power BI Inventory Management Dashboard

Reliable, Robust 3PL Solutions; Now at your service.

With the advancement and improvement in the technologies being used all around the world, one of the noticeable ones is the power business intelligence dashboards. They are data visualisation and information management tools actively used for examining the data. 

BI dashboards are a great tool that helps developers integrate different reports, charts, and graphs into their work. They put them in a much better position of gauging the position of their business, as essentially the main purpose of a BI dashboard is to provide a clear overview of the relevant activity on a single page. As such, they help save time, effort, and energy in a lot of ways! 

BI platform has become a very popular way of simplifying business development in this day and age for the reasons mentioned above, as well as many other reasons – and we will be diving into all of them in this guide. 

So, if you are looking forward to learning more about different types of dashboard, as well as take a look at what an inventory management power BI dashboard is then you have come to the right place.

So, without any delay, let us dig right into it.

Understanding Power BI Dashboard

The first and foremost point to understand is that dashboards are essential to creating an organization’s strategy. And since they are so crucial for the organization, it is important to understand that the dashboard should then have some important features. 

It should not only be purpose-built but should be active enough to analyse the data from primary data sets. This will, in return, help to improve the business decisions further. 

Before the presence of datasets or any related technology, the analysts manually did all the work. This meant compiling different spreadsheets, which could then be accessible with modern BI platforms. Through the use of these BI platforms, the data could be accessed, displayed, analysed and only shareable through the web-based dashboards. 

However, the invention of these BI dashboards changed everything. 

Stakeholders can now create dashboards using a robust, automated business intelligence platform to review, draw conclusions, and act.

As such, BI dashboards have now become a crucial part of any business’s development strategy – you can simply not hope to be successful as a business without integrating a BI dashboard into your activity. Yet, to do that, you also need to have a clear understanding of what BI is, and how exactly a BI dashboard can help you evolve as a business in every single regard.

Power BI Inventory Management Dashboard - Understanding Power BI Dashboard _

What is Business Intelligence (BI)?

A technology-driven process that can be actively used to analyse and evaluate data to later deliver actionable data to the management, including stakeholders and employees, to make improved and better business decisions is how business intelligence can be defined. 

This system allows the organisations to gather data from all the internal and external IT systems, run it for analysis and various queries against the data, and create data visualisations. 

Then there are BI dashboards and reports that are part of the BI process, which allows creating ease by providing the analytics results to all the business users to make informed and operational decisions and do prior strategic planning for the company. 

The final purpose of BI projects has been to drive even better business decisions than before to optimise the profits earned by the companies. This will also allow the organisations to improve their operational efficiency, increase revenue, and gain a competitive advantage. 

To do this, BI combines analytics, data management, reporting tools, and numerous data management and analysis approaches in one easy and accessible for all system. 

BI Dashboard Defined

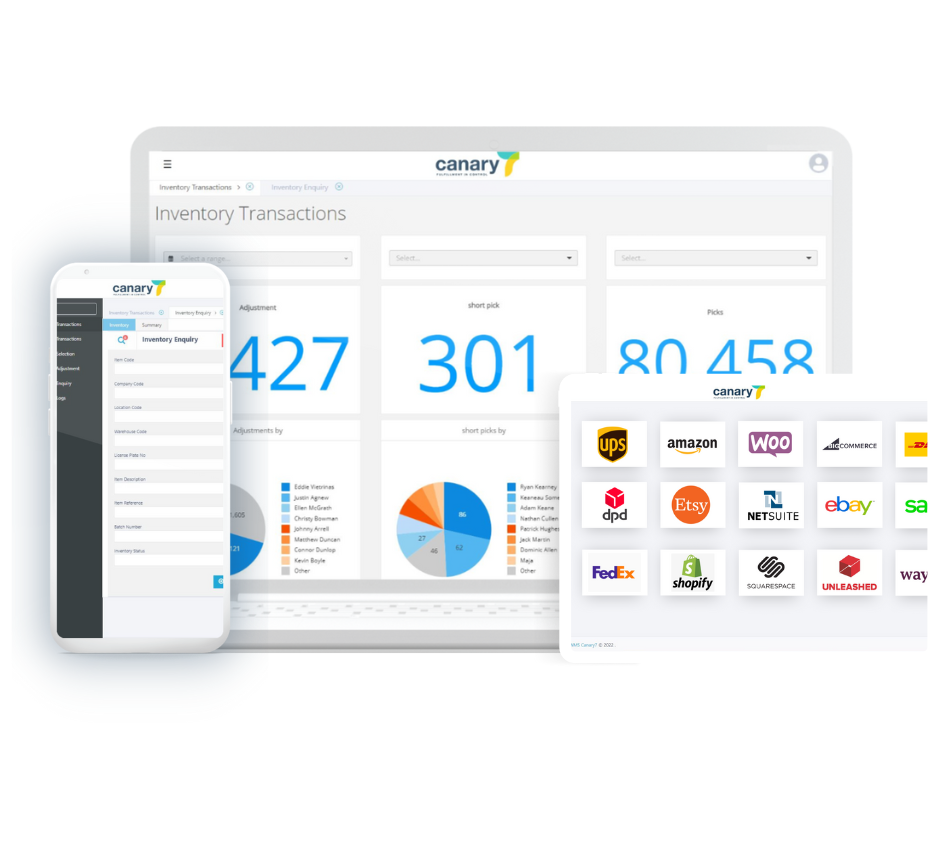
A business intelligence dashboard is a technology that allows users to monitor, analyse, and report on performance indicators and other information. BI dashboards generally depict data in charts, graphs, and maps, allowing stakeholders to understand better, share, and interact with the data.

Think of it this way: a BI dashboard provides you with an organised, interactive report of your business activity that you can access anytime you want and even use it in accordance with your preferences; whatever they may be.

Why Use a BI Dashboard?

A lot of the time, companies and employees ask why they should use a BI dashboard and what is its use. However, there is one thing to understand a BI dashboard is essential in these modern times and can help you immensely in your businesses. 

Modern business intelligence approaches will prioritise technologies that make data analysis more accessible and participatory for users of all skill levels. Integrating corporate objectives with data can help your company become a data culture.

If you still have questions, you can choose to have a look at different evaluation guides to understand better selecting the right business intelligence platform. 

However, this is not where it all ends. There are BI dashboards and BI reports, and most people would not be able to understand the meaning between the two. 

Dashboards and reports are key components of corporate data, and dashboards can assist users in comprehending complex information. Dashboards are excellent for stakeholders that require quick snapshots of performance. Reports are intended for stakeholders who need additional information and wish to slice up data to unearth insights.

Further differences between the two include that Dashboards and reports can complement each other to provide a full perspective of trends and patterns, but they are not the same thing. Using cloud-based technologies, dashboards can be modified in near-real-time. In addition, they are usually graphic and interactive, letting the user interact with the data and generate their assessments. Reports, on either hand, are static—they provide detail but require the end-user to derive insights from a collection of data.

Key Features of BI Dashboards

The advanced and new BI platforms offer many key features that can persuade you quite quickly to start using one yourself.

Customisable interface 

One of the key features of BI dashboards is customisation – you can alter and change certain aspects of the dashboard in accordance with your preferences, which means you are fully in charge of its performance. As such, the BI dashboard can be changed to completely fit the needs of your business.

Interactivity 

Another distinct feature of BI dashboards is that they are interactive. This means they provide a dynamic experience, and can be interacted with to get the best results. Again, this is amazing for businesses as this simply means that they have the leverage to use the dashboard in a way that is the best for the development of their business.

Capabilities to pull near-real-time data 

Real-time data is what essentially makes BI dashboards so useful. Therefore, one of the key features that a BI dashboard will offer businesses is the ability to not only pull real-time data, but utilise it in a way that really improves their operational efficiency in multiple areas.

Can be accessed through a web browser 

A BI dashboard will always be easily accessible, which is what makes it a great fit for any kind of business. As such, almost all BI dashboards can be accessed through a web browser, which means that you don’t need to concern yourself with any technological infrastructure requirements.

Offers Standard and basic templates 

A BI dashboard will also offer you templates, which means you don’t have to start from scratch when it comes to actually utilising the reporting feature of the dashboard. Generally, they will also come with different variations so you don’t have to worry about which one aligns with your requirements the best.

Sharing capability to stimulate collaboration

Perhaps one of its best key features, however, is that a BI dashboard offers sharing capabilities. This means that the data you are working with can be shared across to other members of your team, and this way you can improve your collaborative journey together.

All of these aspects contribute to the purpose of BI dashboards and result in overall advantages for users and organisations.

Advantages of BI Dashboards

With having to explain the BI dashboards above, we now move on to the part of discussing and mentioning the various advantages of BI dashboards. Some of the benefits of the BI dashboard are:

  • Organisations can utilise business intelligence dashboards to make complex data more understandable and appealing to non-technical users.
  • IT may create content as a starting point, but business users can design and see their dashboards. Likewise, non-technical individuals can engage with data via self-service BI.
  • Dashboard-based data visualisations can assist corporate users in identifying trends. They can detect good patterns, isolate negative trends, and provide forecasting insights.
  • Banks can use the technology to construct their performance dashboards and track consumer satisfaction with their products without having to sift through pages of spreadsheets.

Inventory Management BI Dashboard

This Power BI inventory management solution allows you to monitor warehouse inventory levels vs revenue patterns across sales channels, examine short-term financial needs for forthcoming stock re-order plans, analyse essential vendors, and hunt for procurement discounted opportunities.

The Role of Power BI Inventory Dashboard

Power BI Inventory Management Dashboard - Increased productivity

1. Increased Productivity

A well-organized and methodical stock management procedure allows for more work to be completed in less time. Using inventory management dashboard software will save the time required to handle, inspect, and monitor the goods. 

You can check the stock levels on your inventory from a single interface, track what’s selling and what’s not, get vendor information, and link to digital payments for invoices and purchase requisitions.

2. Improved Customer Service

Fulfilling the needs and wants of the customer is very important. Due to the low stock alerts, inventory software will send alerts to the device; this way, the company can maintain the stock. 

With all the vendor information in one place, you can order more by merely looking at the quantities on hand and ordering more quickly.

The customers will know you have what they need, making them grateful for your services, and they will shop from you repeatedly. The inventory management software can assist you in retaining and acquiring new consumers.

Power BI Inventory Management Dashboard - Improved Customer Service
Power BI Inventory Management Dashboard - Increased Profitability

3. Increased Profitability

You can gain business insights into what things are successful this time and what goods can go the following period using inventory management software. With the inventory and monitoring reports indicating what is selling well or poorly, you can invest in the stock that sells equals a larger profit for your company.

A successful inventory management dashboard entails understanding and applying that knowledge to make the most of the market and merchandise. This information is provided by inventory software, which allows you to make decisions that will result in a more significant income.

4. Tracking Expenses Accurately

Expense monitoring, including inventory, is essential. Inventory software can generate reports that calculate relevant financial data to assist you in keeping track of your inventory expenses and income.

These inventory and expense reports can help your company during auditing and accounting for your goods. Cross-reference your inventory with your financial data to ensure the two are in sync for your next inventory audit. Make the most money possible with the least quantity of merchandise.

Power BI Inventory Management Dashboard - Tracking Expenses Accurately
Power BI Inventory Management Dashboard - Automate the Manual Inventory Tasks

5. Automate the Manual Inventory Tasks

The software can help the firm automate power BI inventory management system, increasing count accuracy and income while eliminating human error and costly mistakes. In addition, the automated software provides real-time information and does not waste time counting and recounting stock.

You can simply open your phone to rapidly reference precise information and get computations and expense tracking for quick number crunching and counting without human mistakes.

6. Reduced out-of-date inventory and deadstock

One of the benefits of inventory management is how you can deal with products before it goes bad. For example, you can easily sort the inventory by date to see which orders arrived first, then look at the quantity on hand to see how much you need to sell. 

Get updated about the commodities that might end like perishable stocks, out-of-date inventory, and costs the organization money. The software will help the company reduce waste and repurpose old inventory to save money.

Power BI Inventory Management Dashboard - Reduced out-of-date inventory and deadstock

Start Your Demo Now

Enter your details to book a demo of the Canary7 WMS, built for 3PLs, and fulfillment houses.

How to Pick the Right Power BI Dashboard Inventory Management Software

Companies and firms understand the bonds of data. Still, it can get a little difficult to organise and arrange all of it with so much coming in. Therefore, it is essential to have the right Power BI inventory dashboard to help you get the most usable and beneficial data from countless volumes. 

There is numerous software present in the market, but you need to see the one which fulfils your needs and requirements. 

To help you in the process of choosing the best software, we have gathered a list. So without any delay, let us get to it. 

1. Examine BI tools

You should have a good grasp of how your company employs insights, and your co-workers want to use BI tools in the future. First, develop a set of criteria for evaluating each BI platform tailored to your company’s needs. Then, categorize your list into different sections to analyse the platforms better. 

2. Security

Businesses safeguard their vital data, which is a secret, and BI can aid in this situation. Better BI tools will provide stronger encryption and protection, especially cloud-based. 

It can be challenging to have systems for internal security management by allocating user access and access privileges to tighten data protection control further.

3. Reports on rankings or anything comparable

Ranking reports assist your organization in finding areas for improvement and gauging areas where it is succeeding, allowing you to understand your company’s inner workings better. Better BI tools will cater to this capability.

4. Simple accessibility

Businesses with important decision-makers who are frequently on the go and want the ability to examine graphs, charts, and patterns anytime, anywhere can benefit from a BI system that supports many platforms. However, for enterprises that need to work on the go, cloud-based software provides the greatest experience.

5. Integration with existing systems

It will be incredibly useful to select a BI product that offers a seamless connection with existing reporting procedures. This enables businesses to obtain and sort data from many places and sources and enables business users to examine the data. This includes the BI tool’s support for many data sources, including spreadsheets, ERP, and CRM.

6. Check if the BI tool is simple to use and intuitive.

A BI tool should be capable of assisting users who are not technologically aware through the entire model generation process. Simultaneously, they should provide a rich, fulfilling contextual experience. 

7. Functions for data drilling and filtering

The BI tool you choose should include features like a simple way to browse the system and not be limited to search functionalities and filters, so users can readily look up their information. The system should also accommodate users who wish to see the most high-level overview of performance, all the way down to the most specific raw data.

8. Execute hands-on evaluations

Rather than committing to a BI tool instantly, always test it out. While product demos are impressive, you won’t know how well the tool operates unless you test it. Consider factors like the availability of tech help and whether it is charged extra. Then, perform your hands-on testing to check and see if the BI solution will work for you. 

9. Define the business criteria explicitly.

You must have a well-defined approach. Once that’s taken care of, it’s time to focus on the business-critical eligibility criteria. Finally, if the team wants to track history, they will need a BI solution with essential support for expanding dimensions that may be customized.

Conclusion

The goal of the article was to explain the inventory management power bi dashboard and help you understand the benefits that you can reap from it. Once you have obtained one software and integrated it into your system, your system will start to go faster and will provide you with a much-streamlined work process. 

If you are looking to pair a robust inventory management system with your BI warehouse dashboard, Canary7 is a great option to look into. Try our 30-min, free of cost demo, and transform your inventory management journey like never before!